
The Equal Employment Opportunity Commission (EEOC) publishes data showing how many charges were filed annually and I’ve noticed something peculiar with this data.
For those not familiar, these charges constitute the total number of claims filed with the EEOC for various harassment and discrimination cases (Race, Sex, National Origin, Religion, Color, Age and Disability) as well as claims of retaliation and violations of the Equal Pay Act of 1963.
You’ll notice on the graph below that something happened around 2008 that caused a larger number of charges to be filed and that number has been pegged high at about 98,000 per year for the past 6 years.

And this increase wasn’t confined to a particular type of discrimination/harassment area because all of the case types increased in magnitude at the same time (you can follow the link above to verify this fact for yourself).
Why has there been an unusually high number of EEOC charges over the past 6 years?
You’ll notice from the graph above that there was a smaller uptick in EEOC charges around the 2001 time frame so it may be correlated with the US economic situation (we had recessions in 2001 and 2008).
I grabbed the US GDP growth rate for these years and added this data to the graph and you can see that as the economy takes a dip, EEOC charges increase.

I guess this makes sense. As the US enters an economic downturn there are more layoffs, terminations and closings and people might be inclined to think they were singled out due to discrimination or retaliation. People may also be faced with a loss of income and looking for a way to get a quick infusion of cash by bringing and EEOC claim against their former employer in hopes of a quick settlement.
It also makes sense that the EEOC charge increases in 2008/2009 would be more than in 2001 since the latter recession was much more severe than the former – The 2001 recession only lasted about 8 months but the 2008/2009 recession lasted almost twice that long at about 15 months (Q4 2008 through Q4 2009).
But why has the number of EEOC charges remained high well after the 2008/2009 Great Recession ended?
To help answer that question let’s first look at a graph showing how well EEOC charges are correlated to US GDP Growth rate for this period.
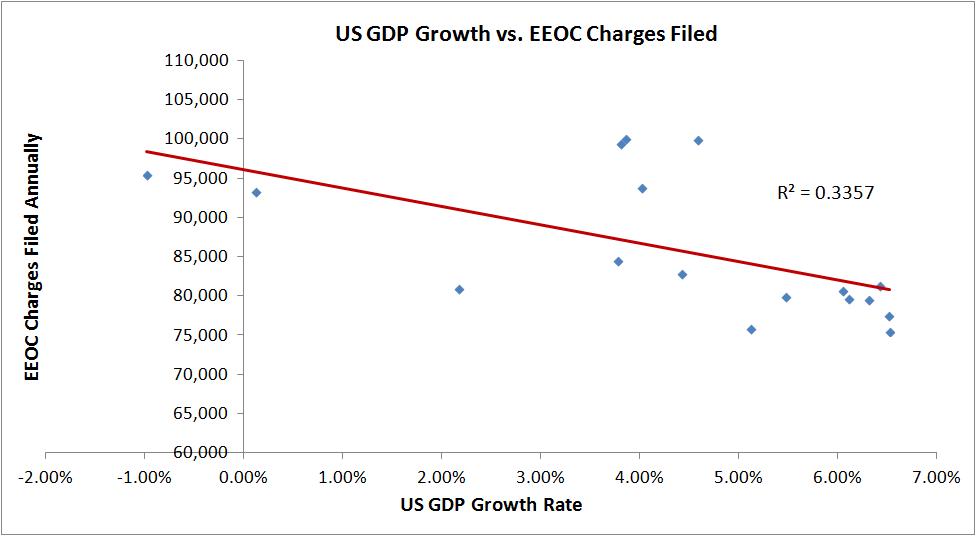
The Correlation Coefficient (R2) is only 34% and that isn’t a very good correlation but keep in mind that while the US GDP has been growing for the past 4 years, the EEOC charges are still high (which is in stark contrast to the recovery after the 2001 recession when EEOC charges dropped).
What happens if I look at the correlation with the last 4 years removed?

Now the Correlation Coefficient is 79% so this graph provides a much stronger case that EEOC charges are correlated with US GDP Growth.
So something special has happened over the past 4 years during the Obamanomics ‘recovery’ that has still kept these EEOC charges high and contradicted the historical trend that states EEOC charges should’ve come down during a recovery from a recession.
Is the US not really in a true recovery like we’ve seen in the past and the slow growth has still left many people looking for work or suffering from layoffs? Probably, since the Obamanomics recovery has not measured up to other recoveries from a deep recession.
Or has there been a cultural shift in the US where more people have an entitlement mentality and are looking to get a quick buck at their employers’ expense?
Probably a little of both but this data should not be ignored. Something has changed in the US over the past 5 years and this EEOC data is trying to tell us something. We’d be wise to listen to it.

It’s interesting too, that 2006 and 2008 (whenthe EEOC graph climbed) were years the Dems took control and then more control. Did that empower minorities?
I used to frequently appear at EEOC hearings to defend my decision to terminate employement. The hospital was in a minority neighborhood and we employeed many who lived close by.
It could also have to do with how many employees are terminated for whatever reason. Though your graph certainly shows the correlation to the economy.