
With most of the US enjoying unseasonably cool summer temperatures, I thought it’d be a good time to update the global temperature and atmospheric CO2 graphs.
The Earth’s atmospheric CO2 concentration is still increasing at the same rate since 1958 (about 0.125 ppm per month).
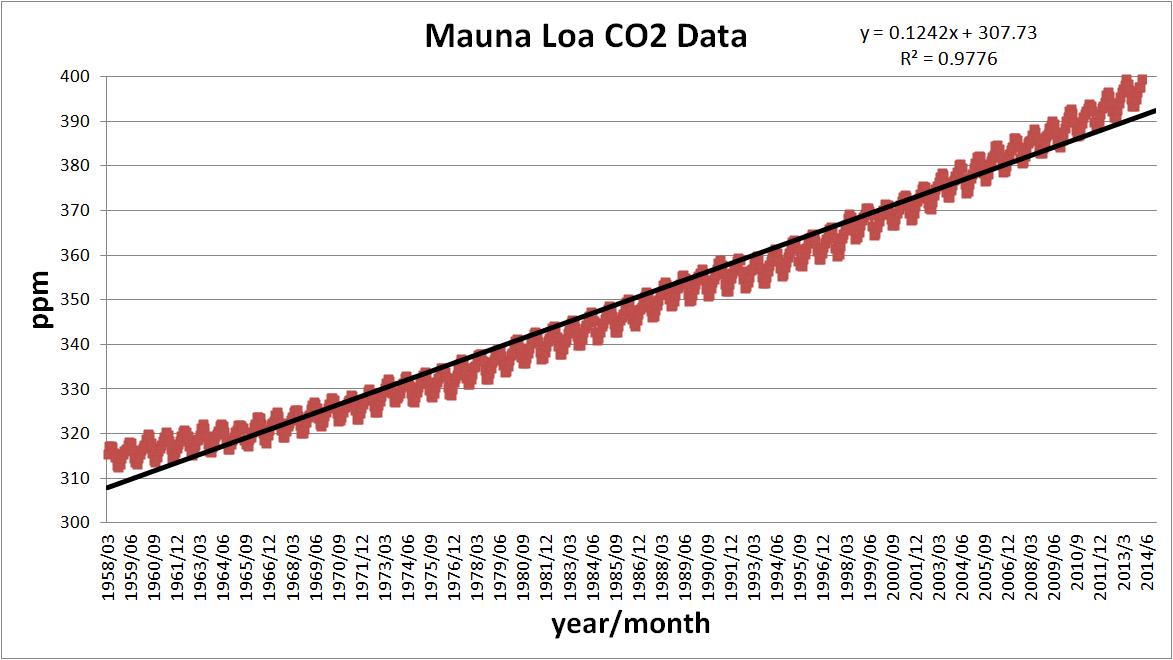
The Anthropogenic Global Warming (AGW) cult tells us that this steady increase in CO2 should be driving our global temperature anomalies higher.
Keep in mind that we shouldn’t confuse ‘weather’ with ‘climate’ and a peer reviewed journal clearly states that we need 17 years of temperature data to assess whether humans are affecting global temperatures.
“Our results show that temperature records of at least 17 years in length are required for identifying human effects on global-mean tropospheric temperature.”
So let’s see if that has happened.
According to the University of Alabama Huntsville (UAH) temperature data, the global temperature anomalies have been flat for the last 17 years (0.0007° C increase per month or 0.0084° C per year).

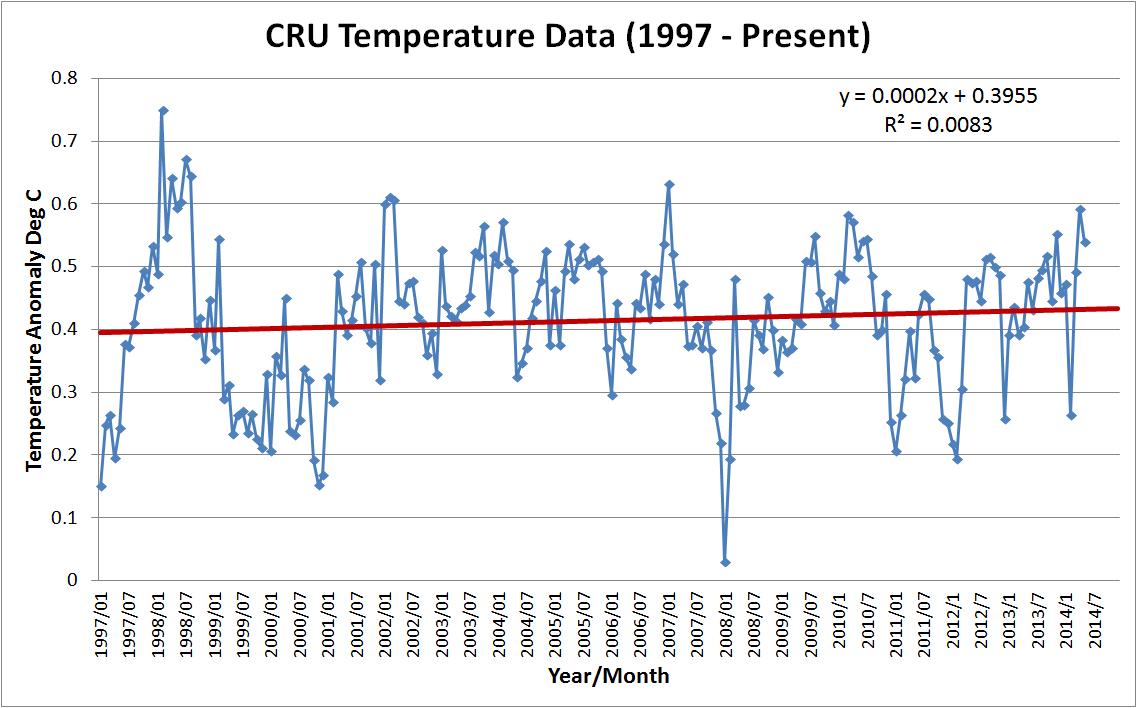
The Hadley Climate Research Unit (HADCRUT3) temperature data shows the same flat temperatures over this same time period (0.0002° C increase per month or 0.0024° C per year).
The Remote Sensing System (RSS) satellite temperature data shows even flatter temperatures over this same time period (0.00008° C increase per month or 0.00096° C per year).

All three of these ‘increases’ are within the margin of error for the measuring instruments so there is clearly no warming trend over the past 17 years even though atmospheric CO2 concentrations have continued their steady march upwards.
Now let’s look at these same three temperature data sets plotted against atmospheric CO2 concentration.
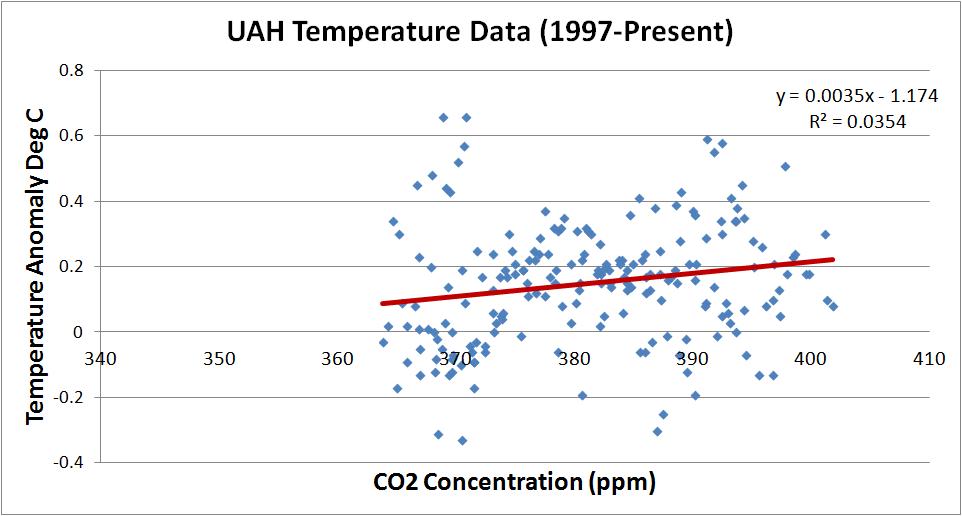
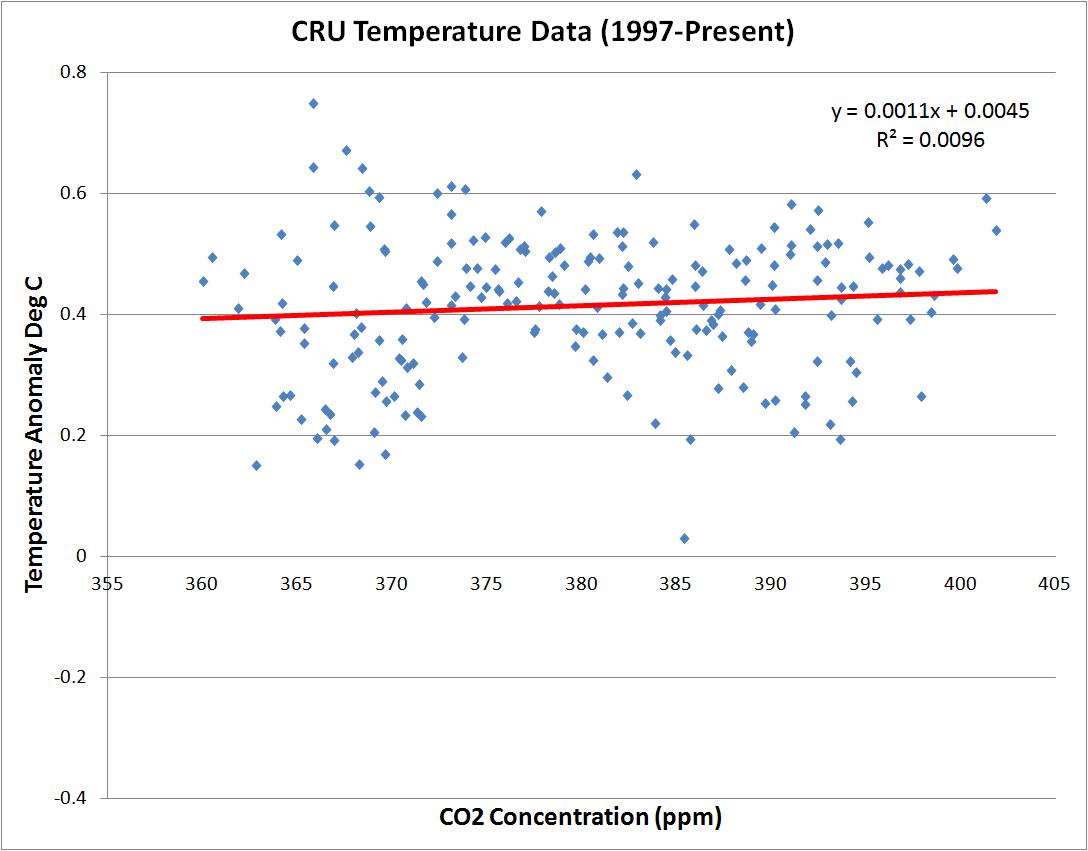

It’s almost like CO2 has no effect on global temperatures but that can’t be because Al Gore tells us that the science is settled!
Remember that in 2007 the AGW cult predicted that the Earth would warm 0.02 C per year if the current rate of atmospheric CO2 concentrations continued. At best, these predications are off by a factor of 2.4 (from UAH data) but at worst they are off by a factor of 20.8 (from RSS data).
The science is definitely NOT settled.

Why are you selecting 1997 as a starting point for your data? Why not use 1991, or 93, or 87, or how about 1979?
There is a very good reason I chose 1997 and the answer is written in the blog post above. I linked to a peer reviewed paper that states 17 years is enough time to draw conclusions about climate/temperatures. 1997 + 17 = 2014.
No. It’s a terrible reason. 1997 is a cherry picked starting point used for the sole purpose of removing from a “presentation” the entire trend history of the instrumental record going back 150 years. The trend is always upward and that is because the absorption of infrared radiation at specific wavelengths and the subsequent recoil emission of IR photons at corresponding wavelengths follows quantum processes, specifically, QED (quantum electrodynamic theory) which is the most thoroughly tested principle in all of physics. Yes, even more so than Relativity.
The 1980s were warmer than the 1970s, the 1990s were warmer than the 1980s, the 2000s were warmer than the 1990s, and so far through 2010 to 2014, this decade is on track to be warmer than the previous one.
7 of the warmest years in the instrumental record all took place in the last ten years…no warming signal? Really? There has ALREADY been 2 years warmer than 1998…even more disturbing, 2013 was a non El Nino year and it was statistically in a near tie with 1998. Non El Nino years are now threatening to set records? That’s curious in light of your presentation.
Here’s some number crunching for you: That 1.6 degree F rise in our planet’s atmosphere during the last 150 years represents more total energy in joules than the USA’s total annual energy production X 4,000,000. Yes, that’s right, it would take the USA, at current energy production levels, 4 million years to raise the total volume of our planet’s atmosphere 1.6 degree F. But CO2 only needed 150 years to accomplish this rise in temperature. With each CO2 molecule absorbing and emitting IR photons 100s to thousands of times each second, heat builds up. CO2 follows QED, as do all of our solid state electronics and our technology in general. Natural variability swings things around on multi decadal time scales, but the trend is always upward.
Sorry, but using 17 years to asses climate trends by cherry picking a year to suit your argument is the worst kind of statistical hackery.
And yet there is no correlation between Atmospheric CO2 concentrations and global temperatures for the past 17 years. Are you saying that the peer reviewed paper that concluded 17 yrs was enough time to draw climate trends should be revoked?
In case you missed the text in the post above, here is the conclusion of this peer reviewed paper:
“Our results show that temperature records of at least 17 years in length are required for identifying human effects on global-mean tropospheric temperature.”
Are you saying peer reviewed papers are no longer valid?
The paper doesn’t say that. You need to read it again. If you ever read it in the first place,
Do you have any idea how ridiculous you sound?
What age are you?
Which pathetic little denier-blog did you get this nonsense from?
You must be new to this denial game eh? Why don’t you try “It’s the sun wots causing it”?
Thats a good one.
Or how about “The warming is caused by giant invisible alien lizard creatures who have established a base at the bottom of the ocean”? At least that ‘theory’ can’t be shown to be absolute tosh within five minutes.
Or why don’t you just make up your own original ‘theory’ instead of copying the old thousand-time-falsified junk that has been doing the rounds of the denierblogs for years. They are sooo boring now that everyone knows they are junk.
Or you could do something no denier has ever done – collate your research and get it published in the peer-reviewed literature and prove that climate change isn’t happenibn because “The laws of physics magical ceased to apply in July 1998”. If you are right you will be an interantional hero and make millions from speaking rights, book and film deals etc. Whats stopping you? You’ve obviously got it all worked out and can prove an entire century of reasearch by over 20,000 climate scietists is wrong.
Go on – go for it – you know you are right.
you wrote “Remember that in 2007 the AGW cult predicted that the Earth would warm 0.02 C per year if the current rate of atmospheric CO2 concentrations continued”
however, the article you linked to reads “For the next two decades, a warming of about 0.2°C per decade is projected for a range of SRES emission scenarios.”
nevermind…math is hard….
0.02C per year is equal to 0.2C per decade. Like the comment below said – “Math is hard”
This is just ridiculous. Cherry picking the highest point of the global temperature spike caused by the Super El Nino event of 1998 as an arbitrary start point is such an obvious and utterly transparent attempt to deceive I’m surprised even a sordid liitle denierblog host would try to get away with such nonsense.
Besides, the graphs show continued warming anyway. And you might like to inform you handfull of disciples that there is roghtly a thirty year lag before the CO2 emissions show the corrosponding reaction in global temperature. This means the warming we are seeing today is the reuslt of emissions released in rhw 1980’s.
And just in case there is anyone left alive who doesn’t know this – there never has been nor ever will be a linear rise in global temperatures. There is far too much natural variation and it takes at least thirty years before the trend can be seen.
Meanwhile the last few months have been the hottest on record and the last decade has been the hottest for probably 7,000 years.
Now that man-made climate change is an obvious everday reality all over the world the last-of-the-deniers in their alternate universe sound shrill, deperate and, frankly, a little insane.
If you seriously believe the laws of physics suddenly and magicaly ceased to apply in July 1998 you need professional help.
Grow up sonny – we don’t have time for this ridiculously amateurish nonsense any more.
And worse than that – you’re just boring,
I know you’re frustrated lesliegraham1. The AGW cult is now getting caught in their own web of lies they have produced for decades. You hold up peer reviewed papers as your Holy Scriptures and now they are contradicting themselves. The paper I reference above says 17 years is enough time to gauge human’s effect on climate but now you say it takes 30 years. Has that original paper been retracted?
And as you can see from the link below, temperatures in your area of the world have been quite flat for about 40 years.
http://data.giss.nasa.gov/cgi-bin/gistemp/show_station.cgi?id=507933090000&dt=1&ds=14
Pingback: New Branch of AGW Cult Science | cosmoscon