
We all know that atmospheric CO2 levels have increased over the past 50 years and this graph (from the Mauna Loa Observatory) shows that.
 You’ll notice that there is an oscillation pattern imbedded on the linear increase and this is due to the Earth’s seasons – During Northern Hemisphere winter CO2 is released from dying plants and during the Northern Hemisphere Summer the atmospheric CO2 drops as the plants use the CO2 for food. This is commonly referred to the collective ‘breathing’ of plants.
From this NPR story, there is a new study that claims this breathing has become stronger:
“Scientists at Scripps and elsewhere are publishing a new study that looks at that global breathing pattern in detail. The new data include air samples taken from an airplane that flew repeatedly over the Pacific Ocean, from one pole to the other, to look for small differences in carbon dioxide.”
“The group reports in Science magazine that the teeth in that saw-tooth pattern have grown bigger over the past 50 years.”
“The vegetation is taking deeper breaths, if you will,” Graven says.
To verify this claim, I’ll perform this same calculation but first some details. Keep in mind my results won’t be an exact apples-to-apples comparison with the report mentioned in the NPR story. The atmospheric CO2 data I’ll be using come from Mauna Loa and are obtained at the observatory located at 3.397 km and if you’re interested in graphing it yourself, you can find it here. The report mentioned above used airplanes flying over the north Pacific and Arctic oceans at 3-6 km altitude to measure the atmospheric CO2. So I’d expect some difference in the actual results but the order of magnitude of our calculations should be the same.
For the record, the report compared CO2 amplitudes (the difference between the highs and lows of the oscillation) between current and 1958-1961 and found increases in amplitude of 25 – 50%. Keep that number in mind because you’ll see below that the calculations I performed on the Mauna Loa data show increases much less than this.
Now let’s look at the Mauna Loa data. The following two graphs show atmospheric CO2 levels from 1958 to 1963 and from 2008 to 2013. Both graphs cover 15 years and they are spread 50 years apart – just like the recent report.

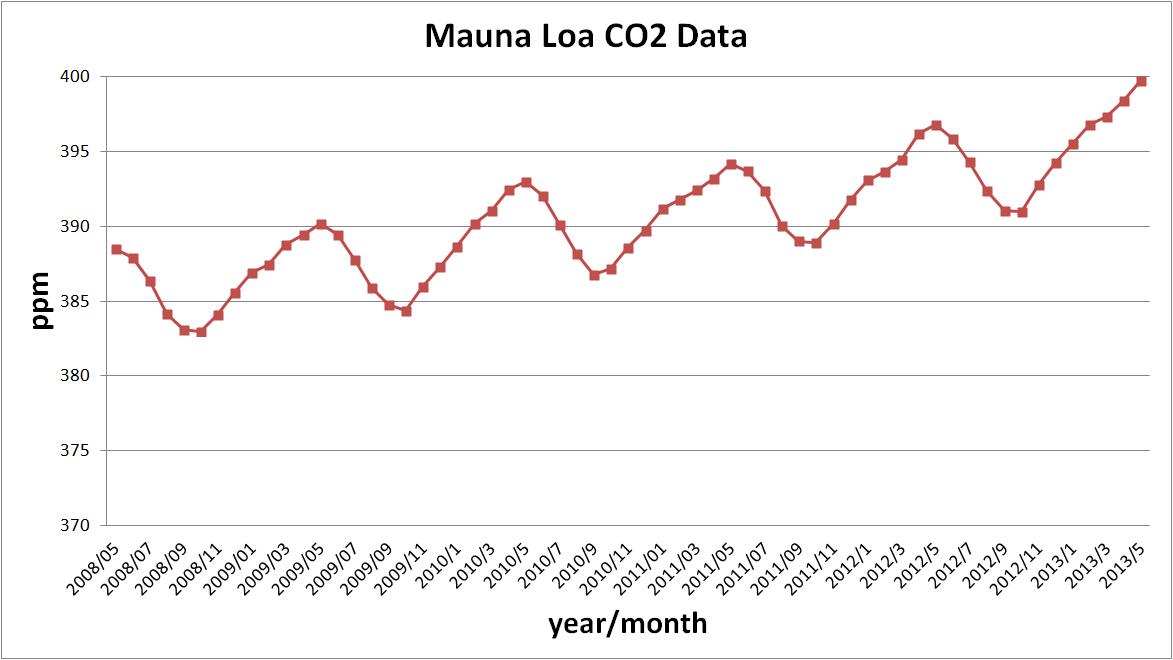 You’ll notice that both have similar frequencies of oscillation (4 lower points and 6 upper points) but it’s hard to tell if the magnitude of the oscillations (the ‘breathing’) is the same. I performed this calculation and the magnitude of the peaks are plotted in the following graph.
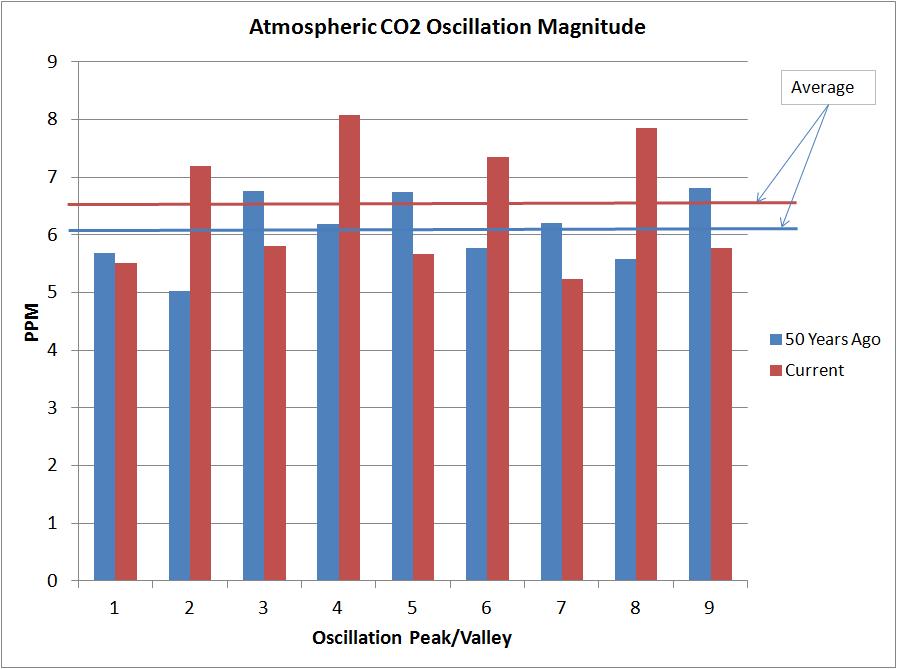 The average magnitude of the CO2 oscillation 50 years ago was 6.09 ppm and the magnitude of CO2 oscillation today is 6.50 ppm. So we’re talking about an increase in the plant breathing of about 0.41 ppm or an increase of 6.7% over 50 years. That’s a big difference between 25-50% claimed in the recent report!
I’ll wait to read the details of this new report to find reasons for the huge discrepancy in results but even if there is a way to reconcile the data, I don’t really know what this report is supposed to tell us.
There is no doubt atmospheric CO2 levels are increasing and we know that plant growth will increase because of this so you’d expect some increase in the amplitude swings as more plants are doing this ‘breathing’ of CO2.
I don’t really have a point here, just interested in performing the calculation and practicing a little math in public!

Your posts on AGW have been a real blessing to a commoner like me, Cosmo, and I’ve forwarded MANY of them to “friends” who have either bought into the AGW cult, or don’t really know where they stand. Too many get caught up in the media hype that seems to over-exaggerate some numbers while completely dismissing those that don’t fit the AGW narrative.
THANK YOU for your commitment to shining the light of truth on the subject!