
The main tenant of the Anthropogenic Global Warming (AGW) cult states there is a direct correlation between increased atmospheric CO2 concentration and increased global temperature anomalies. I will show how this theory is very misguided when confronted with the inconvenient truth of the data.
But first let’s define correlation:
Correlation – The relationship between things that happen or change together.
When you are hypothesizing about a correlation between one input variable (X) and an output (Y) there is a statistical coefficient of determination that is used to measure the correlation and it is called R2.
The correlation coefficient gives the percent probability that can be attributed to the linear relationship between X and Y. Put another way, an R2 of 1 indicates a 100% correlation between X and Y (a change in X corresponds to a proportional change in Y every time) and an R2 of 0 indicates absolutely no correlation between X and Y (variable X can do whatever it wants and it will not affect Y).
What does a strong correlation with an R2 of approximately 1 look like? The Bureau of Labor and Statistics (BLS) provided data showing the relationship between years of education and median weekly earnings and you can see that this correlation is very strong.
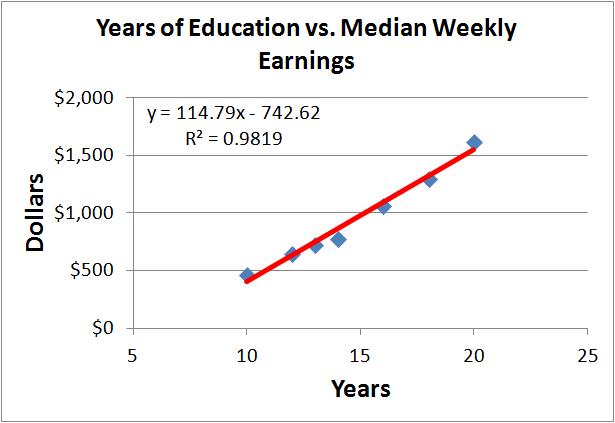 There is an R2 is 0.98 which means there is a 98% probability that years of education affects median weekly earnings (2% of the data represents outliers that have had their median income not dependent on their education level). This is a very intuitive statement and we really don’t need to understand R2 or statistics but in this case the BLS data back it up. From this data we can say with 98% certainty that a person’s weekly income is highly affected by his or her education level.
OK, now let’s use that R2 statistic to test the correlation between atmospheric CO2 concentrations and global temperature anomalies.
(Note – For those who wish to check my work, the atmospheric CO2 data can be obtained from the Mauna Loa observatory, global temperature anomalies can be obtained from the Climate Research Unit and the Remote Sensing System satellite (RSS) global temperature anomalies can be obtained here. )
From the time period of 1958 to 1997 you can claim there is a weak correlation between CO2 and global temperatures – Atmospheric CO2 concentrations had around a 42% probability of altering global temperatures.
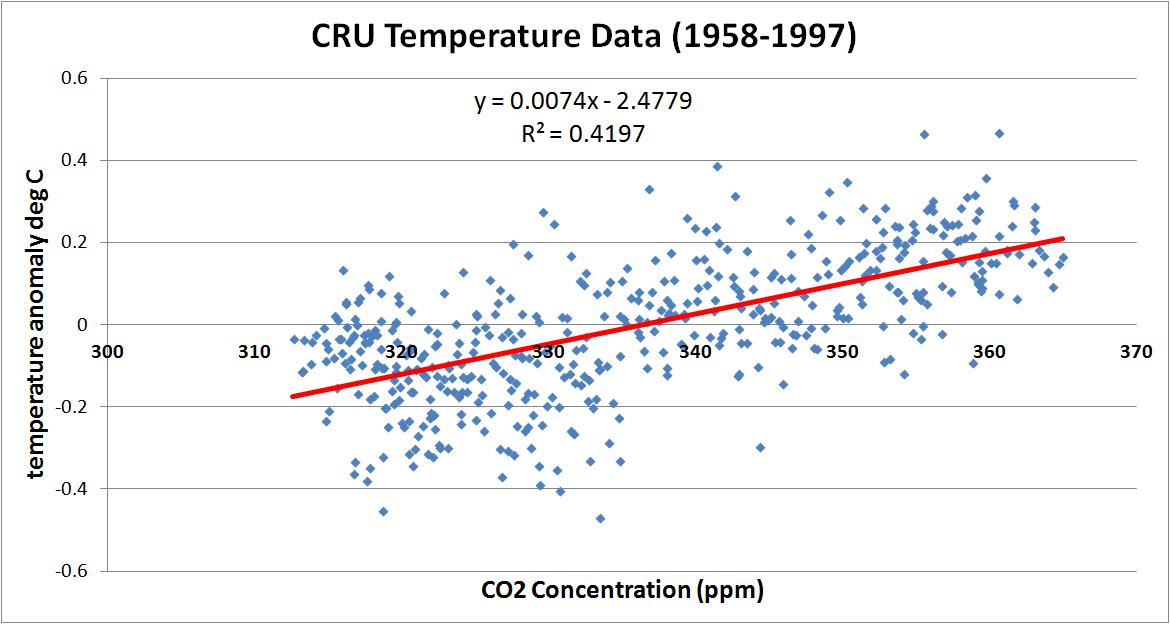 And note this is the BEST time period an AGW cult member will use to show that atmospheric CO2 concentrations directly affects global temperature anomalies because global temperatures were on a fairly steady increase during this period. But at best, we’re talking about a 42% probability of atmospheric CO2 concentrations being the main driver of those global temperature increases.
Now look what has happened from 1997 to 2013.
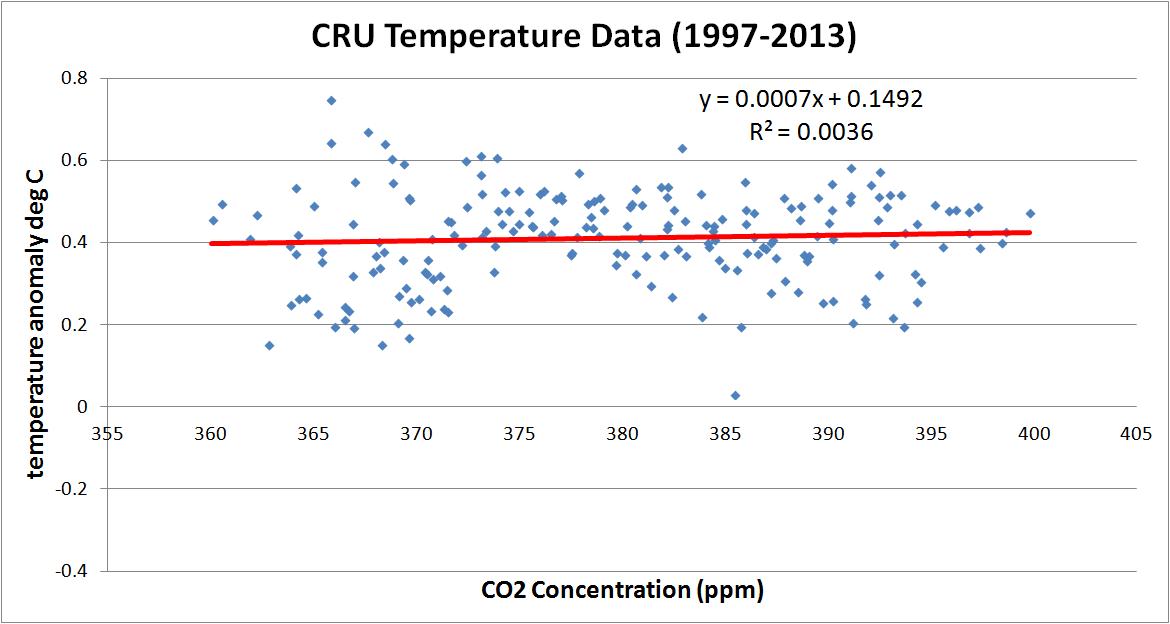 We see a mere 0.36% probability that atmospheric CO2 concentrations affected global temperatures over the past 17 years! That is a very inconvenient truth for Mr. Gore and the AGW cult!
Is 17 years of temperature data enough to make judgments about the Earth’s climate? The AGW cult and specifically the Intergovernmental Panel on Climate Change (IPCC) had no problem drawing conclusions on 15 years of data so yes it is enough time.
“Back then (in 2007), it (the IPCC) said observed warming over the 15 years from 1990-2005 had taken place at a rate of 0.2C per decade, and it predicted this would continue for the following 20 years, on the basis of forecasts made by computer climate models.”
Let’s have some fun and look at the correlation between a variable that should have absolutely no relationship with global temperatures and compare that with the correlation of Atmospheric CO2 concentrations. I obtained the average monthly price for corn in the US from 1979 to 2013 and plotted this against the global temperature anomalies for that same period.
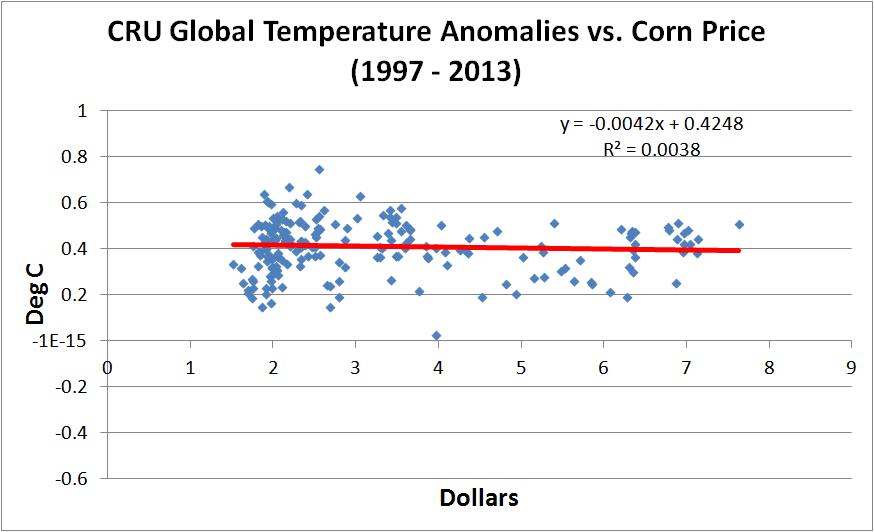 That’s right, during the last 17 years US corn prices have had about the same probability of affecting global temperatures (0.38%) as atmospheric CO2 concentrations (0.36%).
And it gets a lot worse for the AGW cult when you look at satellite temperature data.
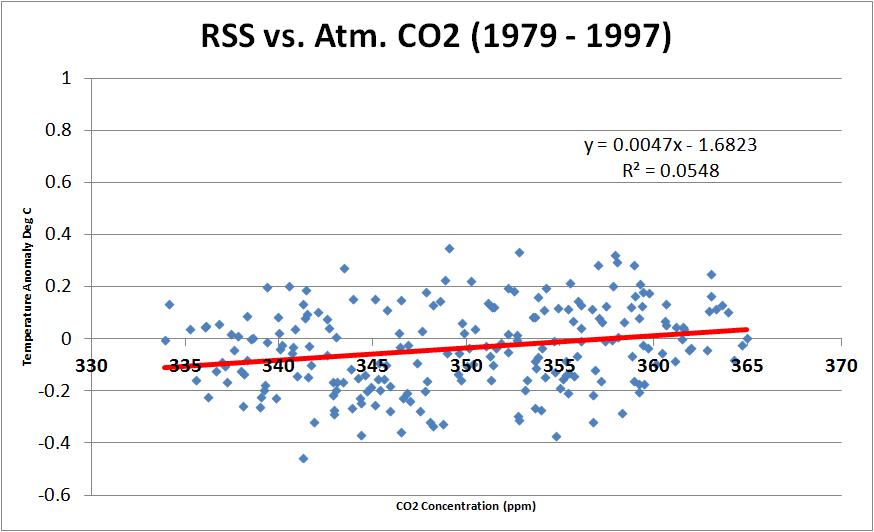
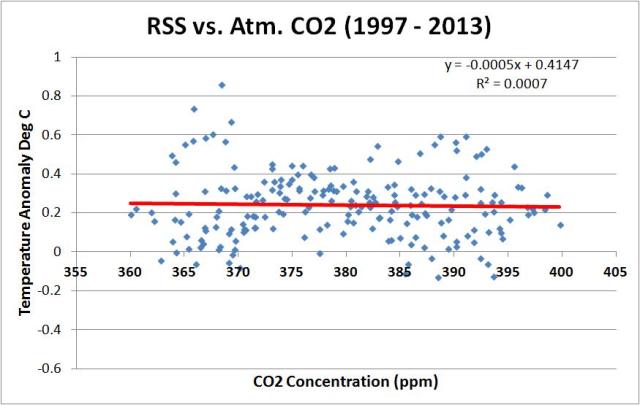
Even for the time period of 1979 to 1997 (when the AGW cult was going crazy because the Earth’s climate was actually warming), RSS data show there is only a 5.5% probability that atmospheric CO2 concentrations can be attributed to changes in global temperatures. To make matters worse, there is only a 0.07% probability that atmospheric CO2 concentrations drove global temperatures during the 17 year period between 1997 and 2013. For those mathematically challenged in the AGW cult, a 0.07% probability means that atmospheric CO2 concentrations have basically done NOTHING to affect global temperatures for the past 17 years.
My final thought – There is no doubt CO2 is a green house gas but CO2 is obviously a minor contributor to the Earth’s global temperature anomalies and any attempt to spin it otherwise is done in ignorance of the available data. It’s time to end this fraud.

Cosmo….would you be so kind as to also demonstrate the “correlation” between being on the Left AND the HIGH level of emotionalism involved. It might also be good to measure the abject LACK OF FACTUAL basis that’s involved in their emotionalism…
GREAT post!
That would definitely have an R-squared of 1.00!!!!
Pingback: MLB Attendance Drives Global Temperatures | cosmoscon
I absolutely love your well documented blogsite….another well written piece thanks cosmo.
Pingback: War On Poverty Update | cosmoscon
Pingback: Global Temperature Update – FEB 2014 | cosmoscon