
The AGW cult has tampered data to the point that it is criminal. There is a reason why only their data sets show warming but untampered satellite data show no warming for the past 17 years.
Yesterday I published this graph, showing almost perfect correlation between USHCN adjustments and NOAA atmospheric CO2 numbers.
Raw: ftp://ftp.ncdc.noaa.gov/pub/data/ushcn/v2.5/ushcn.tavg.latest.raw.tar.gz
Final: ftp://ftp.ncdc.noaa.gov/pub/data/ushcn/v2.5/ushcn.tavg.latest.FLs.52i.tar.gz

I have long wondered why USHCN adjustments are increasing exponentially. They are now nearly 1.5F total.
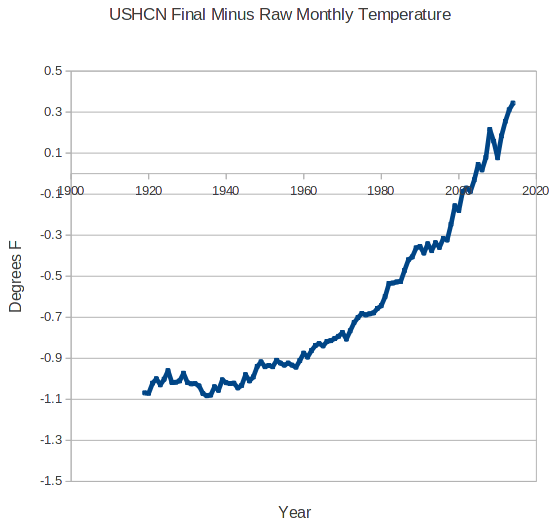
According to USHCN V1 documentation, the adjustments were supposed to level off after 1990 at 0.5F. Instead of leveling off, they have sharply increased and are now almost three times as large as the USHCN V1 adjustments.

The USHCN V2 docs say that they use the same TOBS algorithm as V1, yet TOBS was supposed to go flat after 1990. How can the same algorithm produce dramatically different results in V2?
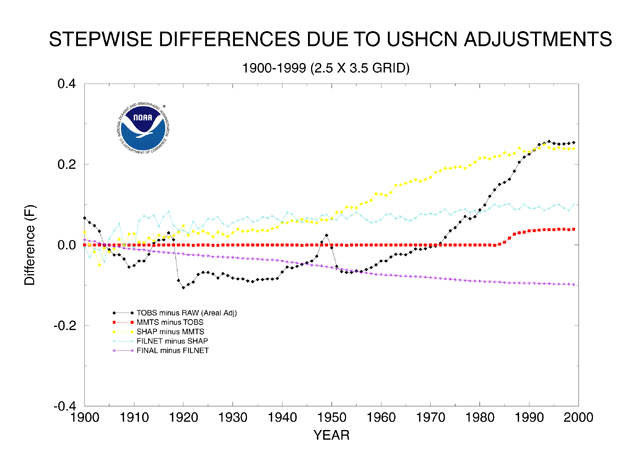
Up until now the adjustments have made no sense, because they didn’t appear to correlate to anything in the real world. But now we can see that correlate almost perfectly with the amount of CO2 in atmosphere. Red below is…
View original post 46 more words
