
Earlier this month world leaders gathered in Peru to discuss how they combat a manufactured problem they now call “Climate Change” (previously called Anthropogenic Global Warming – AGW) and the results were on par with the myriad of previous meetings:
From NPR :
“Most of the world’s governments at a meeting in Lima, Peru, managed to agree yesterday on a new document aimed at curbing climate change. Hundreds of the negotiators who wrote it say the document, which goes to Paris a year from now for final approval, has serious shortcomings. But U.N. climate executive Christiana Figueres says it’s the thought that counts.”
In other words, nothing will be done and in my opinion this is a good thing. The final comment from the NPR story tells you what the real motivation is behind this manufactured crisis (emphasis mine):
“In the end, the basic principle survived. Everyone participates, but developed countries must shoulder most of the burden. There will be more money for developing countries. Details of how this all will work – and there were many pages of them – remained unresolved. But negotiators have a year to wrestle them into submission before the deadline in Paris.”
Make no mistake about it; the driving force behind the AGW cult propaganda is to get developed nations to funnel money to 3rd world countries. It’s always been about this no matter what Al Gore or any of the other cult leaders say.
Now let’s look at the data to see why I call this so-called “climate Change” problem a manufactured crisis.
I’ll graph the global temperature anomalies from three [3] global temperature data sets – The University of East Anglia Climate Research Unit (CRU), the Remote Sensing System (RSS) and the University of Alabama-Huntsville. (NOTE – The CRU data version 3 (HADCRUT3) that I’ve been using for years was abandoned by CRU in May of 2014 so I started using their latest data set (HADCRUT4) for data starting in January 2014.)
Before viewing my graphs, keep in mind that in 2007 the AGW cult predicted that if we continued to pump an additional 3 ppm of CO2 into the atmosphere every year (what we’re doing right now) then we’d see temperature increases of 0.2°C per decade. That equates to a temperature rise of 0.007°C per ppm of atmospheric CO2 and 0.0017°C per month.
Here are the temperature graphs for the past 17 years.
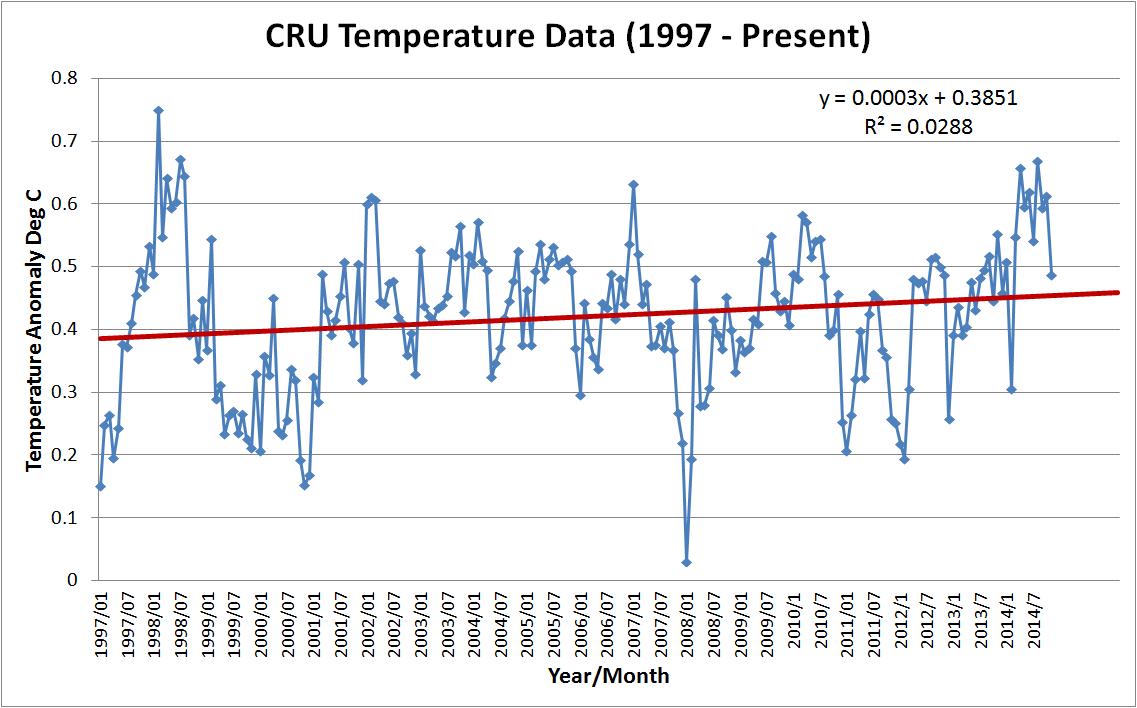

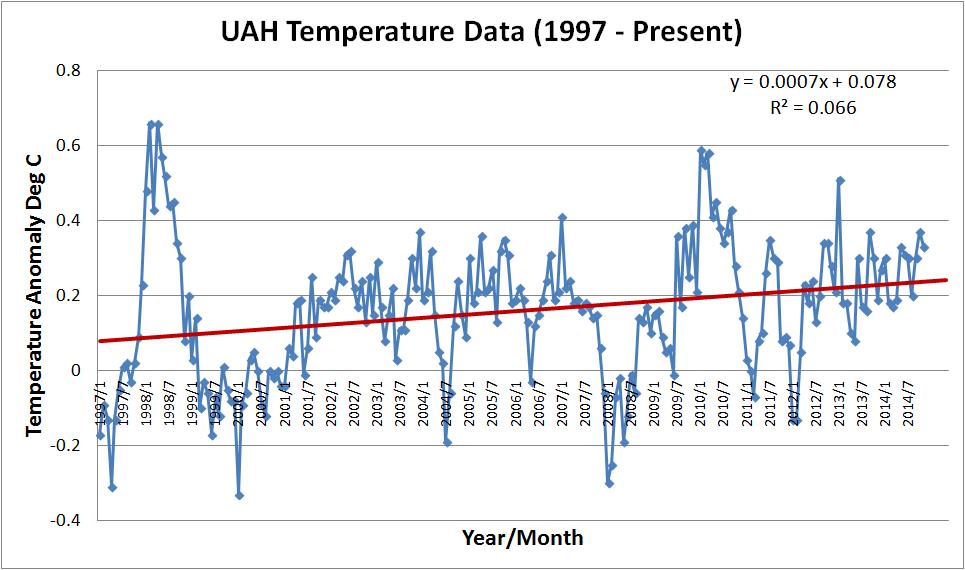
As you can see from above, the Earth’s global temperature anomalies have been flat for the past 17+ years and the anticipated increase of 0.0017C per month isn’t even close to what we are seeing – The AGW cult’s estimate overstated the actual warming by over 5.5 times for the CRU data (0.0003°C/month vs 0.0017°C/month) and almost 2.5 times for the UAH data (0.0007°C/month vs 0.0017°C/month. The RSS data had a NEGATIVE temperature trend for the past 17 years (-0.00007°C/month) so the climate scientists really missed the mark on that one!
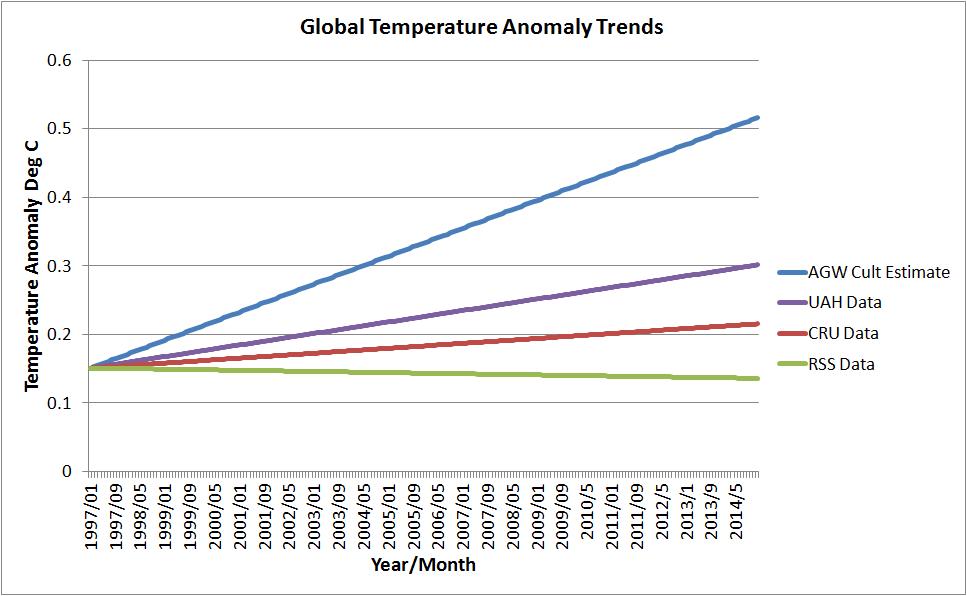
Just to show how wrong the AGW cult is, here is a graph showing the AGW cult predictions as compared to the trends of the three actual global temperature data sets. I started all trend lines at the same point (0.151°C from the CRU data set in January of 1997) and used the slopes of the AGW cult predictions (0.0017°C/month), the CRU (0.0003°C/month), the RSS (-0.00007°C/month) and the UAH (0.0007°C/month).
Now let’s compare each of these temperature anomalies to the atmospheric CO2 concentrations as measured from the Mauna Loa research station.
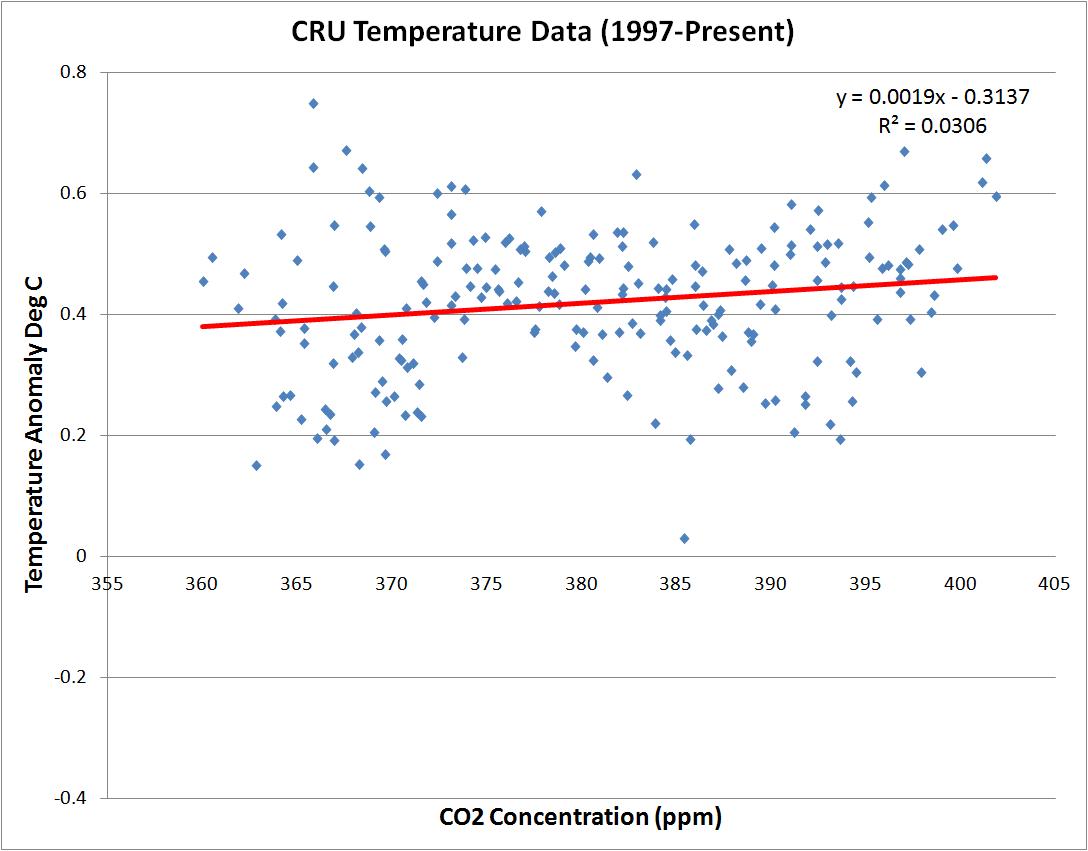

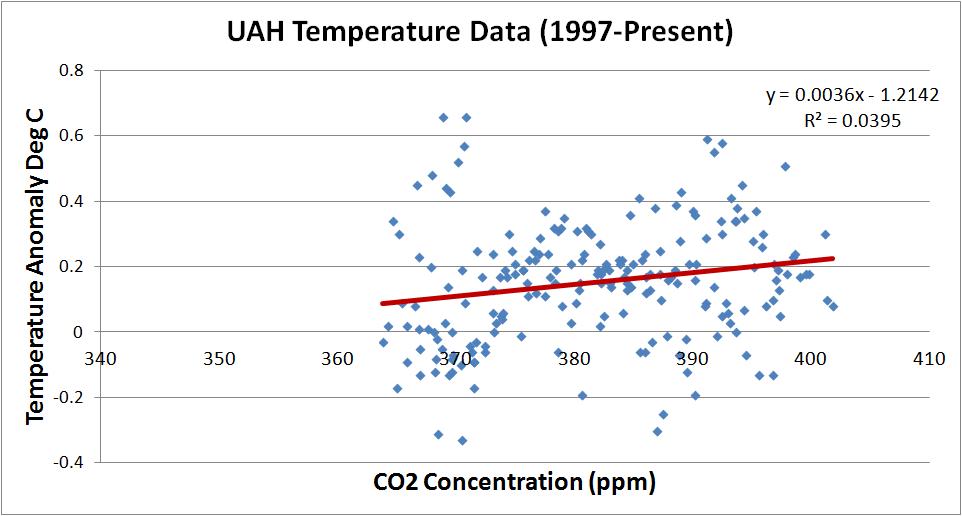
Although the predictions called for a temperature rise of 0.007°C per ppm of CO2, the CRU, RSS, UAH and Mauna Loa data didn’t get that memo. The “Science Is Settled” team was off by a factor of 3.7 per the CRU data and a factor of 2 per the UAH data. The RSS data totally disproved the AGW cult team’s thesis since that data showed a NEGATIVE correlation with CO2 (-0.0006°C per ppm of CO2)!
For those who think I’m “cherry picking” the 17 year time frame, you need to read this peer reviewed paper. It clearly states that we need at least 17 years to gauge the effects of man-made CO2 effects on global temperatures and that is exactly what I’m doing.
“Our results show that temperature records of at least 17 years in length are required for identifying human effects on global-mean tropospheric temperature.”
The AGW cult holds peer reviewed papers up as their holy texts and it must really stink when their most trusted weapons are used against them!
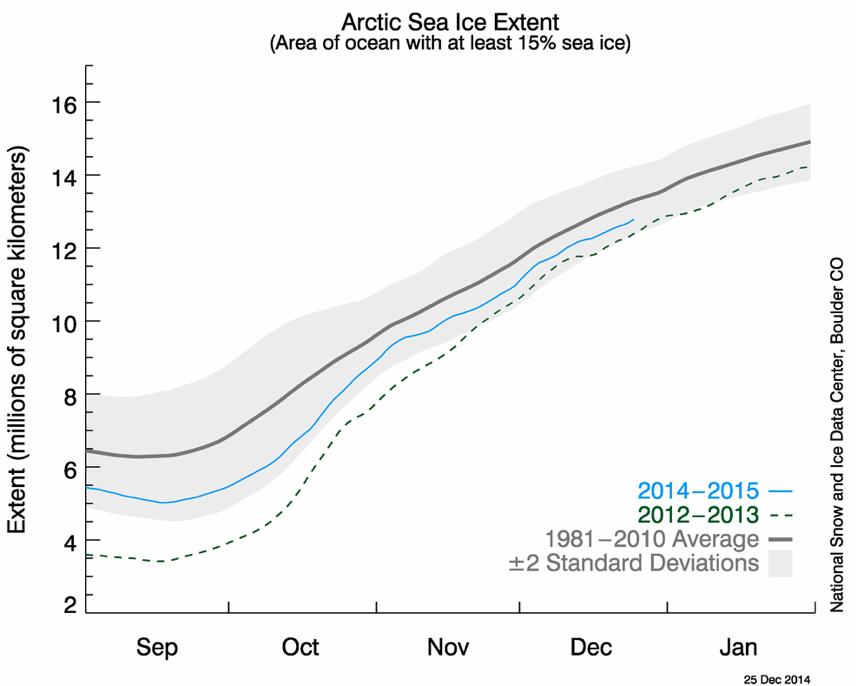
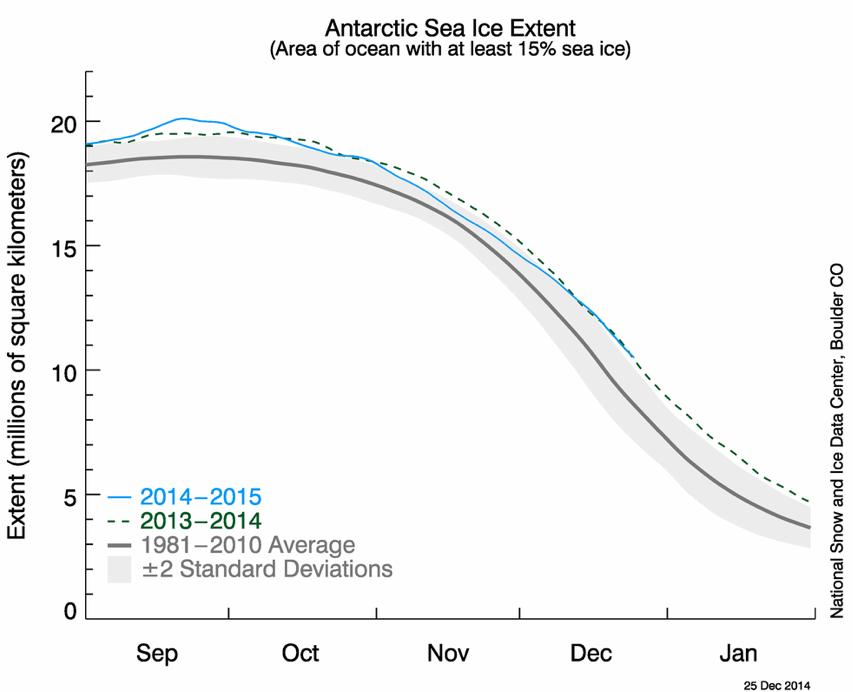
We don’t have to rely solely on global temperature anomalies to show how the AGW cult climate scientists totally missed this one. Global sea ice extent graphs of the Arctic are within the +/- 2 standard deviations of 1981-2010 and the Antarctic is ABOVE those levels.
And it gets worse…
US hurricane strikes have decreased with additional atmospheric CO2, The US has now experienced its longest drought of major hurricane landfall in history, Violent tornadoes have decreased in the US, US forrest fires are down and droughts in the US are at historic lows.
It’s like the AGW cult climate scientists don’t think we know how to use Google or something.

Good info, well presented! Thx 4 doing so!!!
Pingback: CO2 Emissions Are Flat? | cosmoscon