
With the latest Snowpocalypse set to hit the South this week, I figured now was a good time to update global temperatures and show once again how the Anthropogenic Global Warming (AGW) team’s fixation on CO2 is misguided (at best) and more akin to cult like behavior.
Remember, the AGW cult says that increasing CO2 emissions will send the planet on a runaway warming scenario and they have tons of peer reviewed literature to back up their claims.
The AGW rightly cautions us to not confuse ‘weather’ events (a recent blizzard, a few hot days in the summer, etc.) with ‘climate’ events. In fact there is a peer reviewed paper that states:
“Our results show that temperature records of at least 17 years in length are required for identifying human effects on global-mean tropospheric temperature.”
OK, let’s play their game.
I will show 17 years of global temperature anomalies (departure from a base period average) for three well known datasets: Hadley Climate Research Unit (CRU), University of Alabama Huntsville (UAH) and the Remote Sensing System (RSS). In addition, I’ll compare each of these temperature anomalies to the atmospheric CO2 concentrations as measure from the Mauna Leo research station.
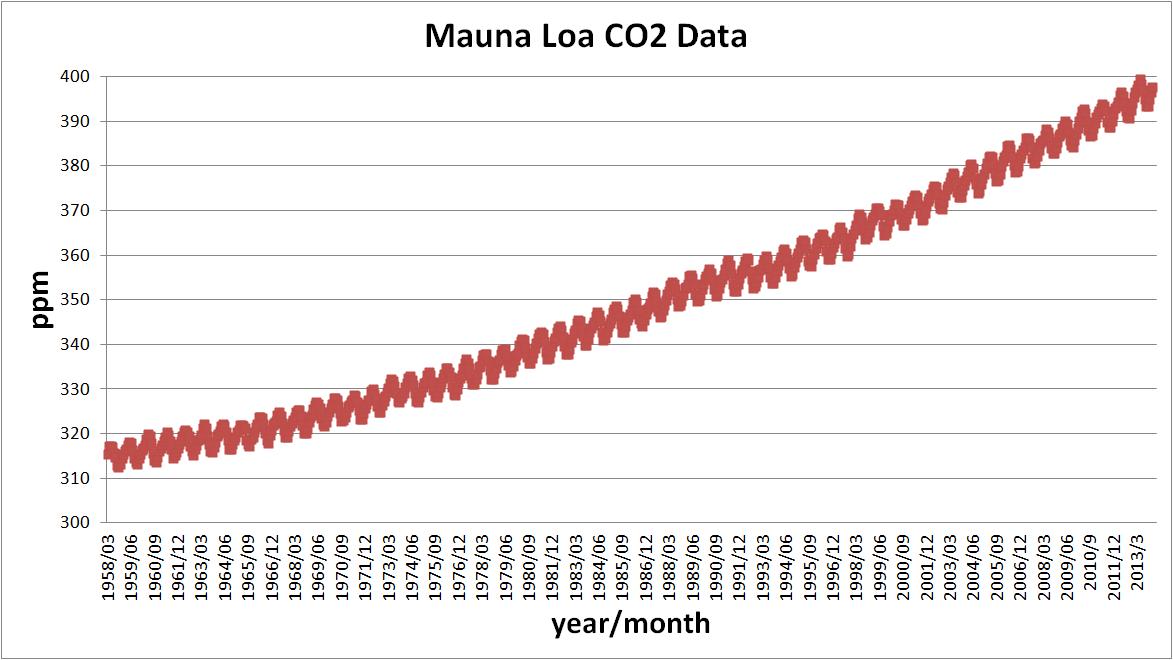
Here is the graph of atmospheric CO2 concentrations and sure enough, we are definitely pumping more CO2 up there and I’ll concede the AGW point that most of this increase is from humans.
 Now let’s see what effect this increasing amount of atmospheric CO2 has had on the three temperature data sets over the last 17 years.

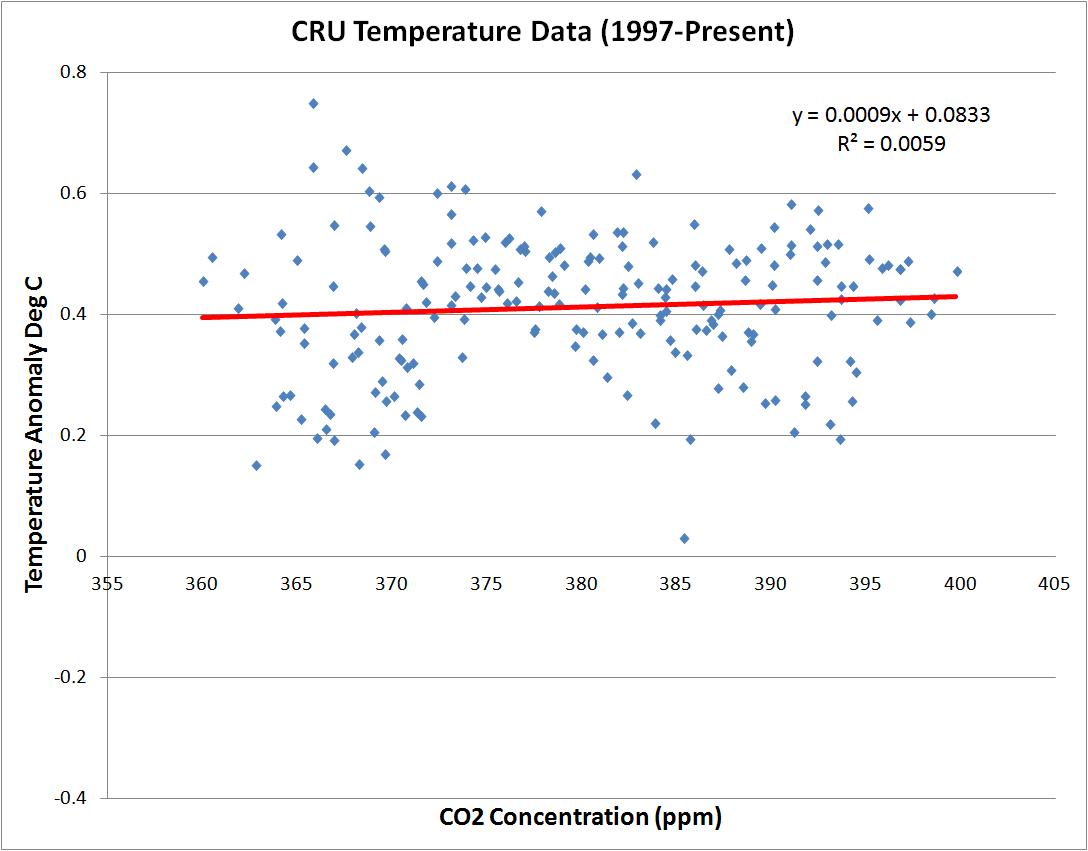
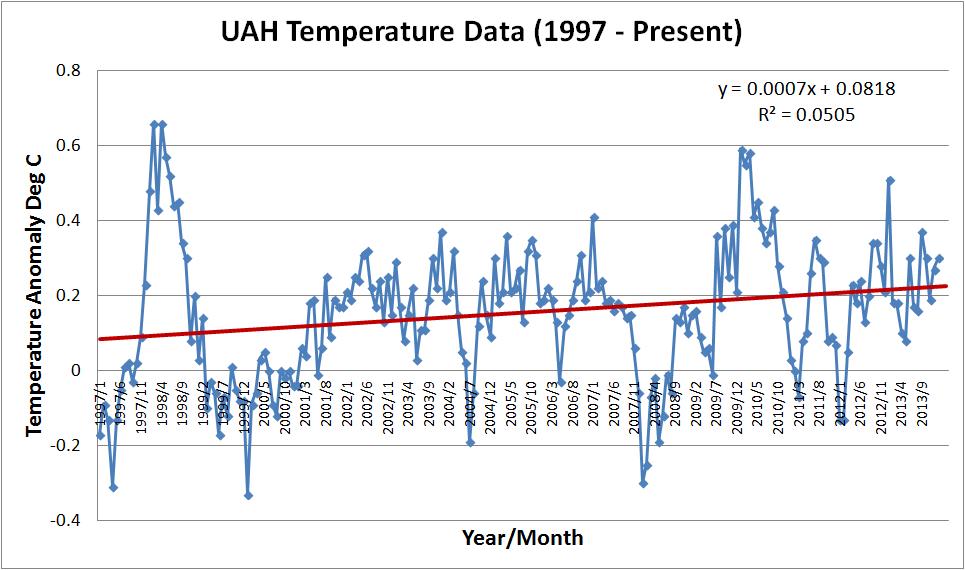

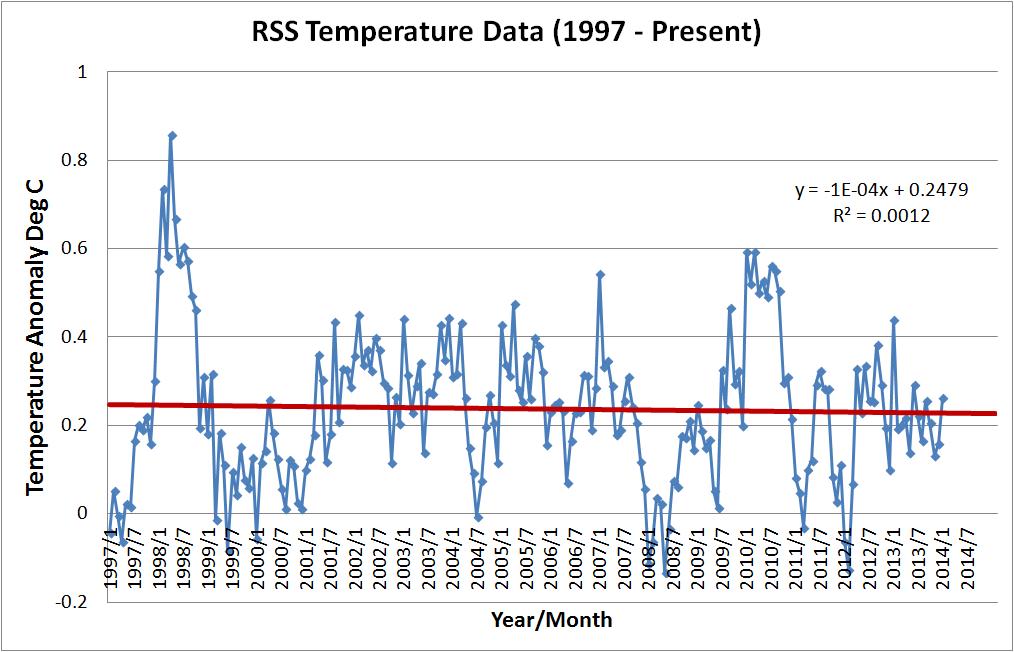
 All these temperature graphs look pretty flat, don’t they? And since this is a time period of exactly 17 years, then we can use the conclusions of the AGW cult peer reviewed paper to confidently state that increased atmospheric CO2 concentrations have NOT raised global temperatures.
As I’ve stated before, the AGW cult has an inconvenient correlation problem. Notice that the correlation coefficient (R2) for all these temperature anomalies vs. CO2 graphs is very low (less than 1% for RSS/CRU and only 3.7% for UAH). This means there is less than a 3.7% probability that the temperature anomalies over the last 17 years were influenced by atmospheric CO2 concentrations.
Is the science settled now?

Reblogged this on libslayer2013.
Friday I watched….I mean literally watched, ice forming on a machine I was working on. AND I LIVE IN SOUTH, NO, DEEP SOUTH, TEXAS!!
eat it you global warming puke faced lying sacks of poop
Thanks for the Reblog brother!
You know it’s always my pleasure.
Pingback: NPR Still Drinking The AGW Koolaid | cosmoscon