
Obama is now making another one of his favorite pivots – this time to Climate Change.
“President Barack Obama is preparing to tell all federal agencies for the first time that they should consider the impact on global warming before approving major projects, from pipelines to highways.”
The Anthropogenic Global Warming (AGW) cult continues to peddle their junk science and Leftists are all too eager to buy it. The Leftist have no need to challenge the AGW theories and compare them with measurable data because they don’t want to learn the real inconvenient truth. It’s easy for them to buy what the AGW cult is selling (and tell others to do the same because the ‘science is settled’ or something) because the AGW message feels so good to them. If the Left believes Humans (and more importantly human industries) are polluting the planet and causing environmental/climate catastrophes, then they can use that ‘science’ to attack their favorite enemy – Capitalism.
Obama’s latest ‘pivot’ reminded me that it is time for my quarterly update on global atmospheric CO2 concentrations and global temperatures. All of this data is easily obtainable from the Internet and takes about an hour if you start from scratch. It’s amazing how many sheeple don’t do this before gobbling the AGW cult lies.
Here is the graph of atmospheric CO2 measurements as gathered by the Mauna Loa observatory and you can see that the CO2 levels are continuing to increase.

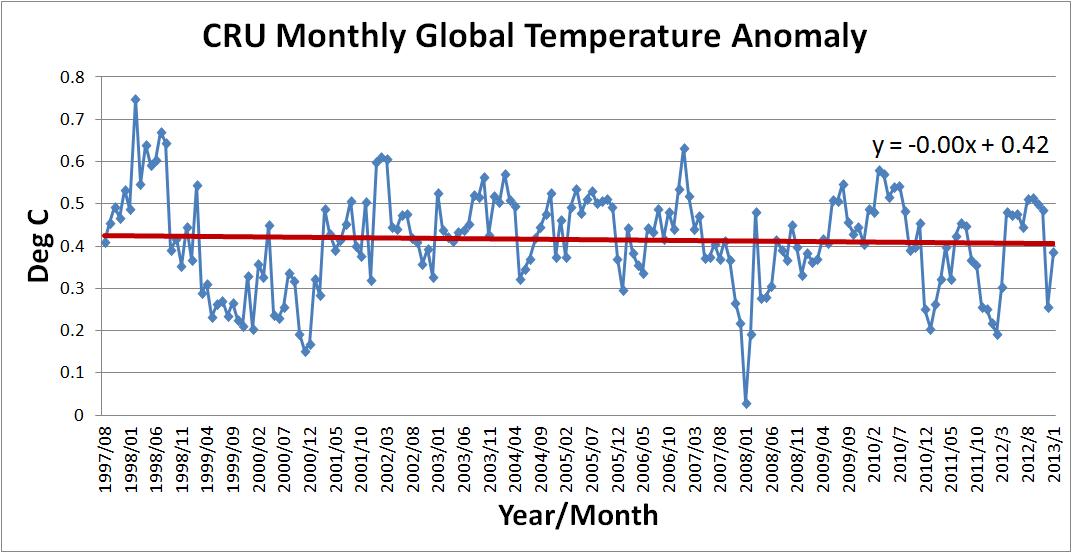
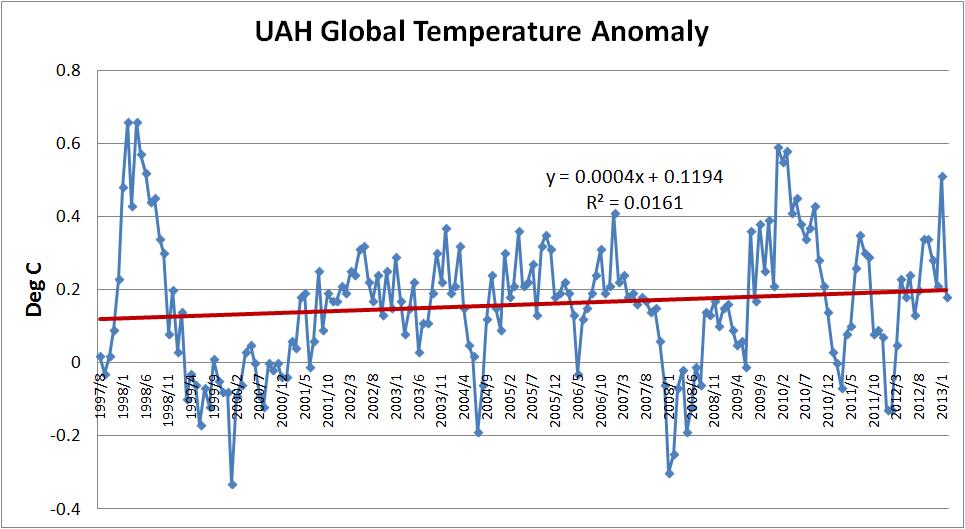
Here are the plots of global temperature averages compiled by the Climate Research Unit and the University of Alabama Huntsville.


Let’s now look at these same temperature graphs but starting with 1998 and you can easily see that we are still in a period of flat temperature growth (I’ve added trend lines with the equation for extra emphasis) for the past 15 years.
Furthermore, if increasing atmospheric concentrations of CO2 cause increased global temperatures then we should see a linearly increasing line when we plot global temperature anomaly (delta from a baseline period) on the Y-axis and atmospheric CO2 concentration on the X-axis. From the graph below, you can see that something happened when CO2 concentrations increased to around the 370 ppm point to stop that upward trend and this inflection point raises questions. Is some other variable(s) counter acting any warming caused by CO2? Has the warming effect of CO2 reached a limit?

If CO2 is this magically powerful molecule that can control the Earth’s thermostat then someone must have changed the internal wiring of our climate system for the last 15 years.
And to add insult to injury for the AGW cult, their latest peer reviewed journal that supposedly blows the lid off skeptical claims that CO2 isn’t altering our climate has been revealed to be another victim of data manipulation. The AGW cult scientists are not just bad scientists, they are evil people.
So ignoring all these easily obtained data and the continued corruption of the AGW cult scientists, Obama will continue to grind industrial progress and jobs creation further into the abyss with this new ‘pivot’ to climate change.
Addendum – I have many posts on Climate Change that can be found here and if you are interested in a deeper dive of the science then I suggest two posts here and here.

Cosmo,
I’m not a scientist and not qualified to judge but you make a compelling case.
Can you give us your take on the Arctic Ice melt issue? This appears to me to be one of the stronger cases the AGW crowd makes.
http://www.forbes.com/sites/alexknapp/2013/02/17/arctic-ice-melt-is-accelerating-even-in-fall-and-winter/
http://nsidc.org/data/seaice_index/
I’ve also read that while Arctic ice is melting, Antarctic ice is now at record high levels,(at least since 1970.)
I’m really confused. I don’t want the Polar Bears to drown.
But seriously, the Arctic is sea ice while the Antarctic is mostly land ice.
Does it make a difference? Can ice in the Antarctic build at the same time global air temperatures are higher?
Also, my understanding is that the Sun has been at a Solar minimum for the last 10 years. Could this account for a leveling of the increase in Global warming as the other side claims?
It’s frustrating because I’m not educated enough to even ask the right questions.
I do think the issues are far more complex than either side is willing to admit.
For me, I think it’s just possible that the big yellow ball in the sky and it’s solar cycles might just have a bigger impact on Earth than anything man is doing or even could do. .
Here’s an interesting 400 year graph in Wikipedia on sun spot observations.
http://en.wikipedia.org/wiki/Solar_cycle
We don’t know if there are longer sun cycles than this because man hasn’t kept records for longer than this.
However there is no disagreement the Earth has been both hotter and colder than it is now in the total absence of man’s influence.
So I guess the questions are:
Can man have a bigger impact on Earth than the Suns cycles? And if so, how do you determine what percentage effect each is contributing?
I can’t even get my head around the complexity of the multivariate analysis necessary to begin to answer these questions even if we had accurate measurements over centuries which it seems to me it would be necessary to know at a bare minimum.
Cosmo, I’m really interested in your take and apologize if you have dealt with this in previous posts I haven’t read.
All great questions Blaine and I’m sorry I can’t answer those questions. If I could, I’d make a lot of money writing books and public speaking!
The climate system is incredibly complex and to answer some of these questions (especially what component of climate change is from humans) requires unwavering faith in models. The same modesl that told us a decade ago that polar ice would be a thing of the past.
I don’t equate ice melt/thickening with CO2 raising earth’s temperatures because like just about every other climate variable, there have been ebbs and flows for 100’s of thousands of years.
Google Vostok Ice core data and become familiar with that. That piece of data is very revealing about Earth’s long term temperature and CO2 cycles.
Also you might want to read an article I wrote a long time ago for American Thinker.
http://www.americanthinker.com/2010/02/the_agw_smoking_gun.html
Looking at journals on Outgoing Long Radiation at first put me into the AGW believer camp but when I realized they obtained their data after filtering it through climate models and that the real data didn’t support their theories, then I was convinced this AGW thing was a lie.
If CO2 did in fact trap outgoing longwave radiation then the satellites should be able to detect it. They didn’t in the raw data. That is a fundamental problem with AGW science theories.
Actually, Arctic sea ice is melting faster than models projected. So model uncertainty cuts both ways.
Do you have a better way to calculate future climate than via a model?
If CO2 did in fact trap outgoing longwave radiation then the satellites should be able to detect it.
In fact it’s easily detectable by satellite, showing up as big gouges in the blackbody spectrum:
http://www.giss.nasa.gov/research/briefs/schmidt_05/
Changes there have been detected too:
“Increases in greenhouse forcing inferred from the outgoing longwave radiation spectra of the Earth in 1970 and 1997,” J.E. Harries et al, Nature 410, 355-357 (15 March 2001).
“Comparison of spectrally resolved outgoing longwave data between 1970 and present,” J.A. Griggs et al, Proc SPIE 164, 5543 (2004).
“Spectral signatures of climate change in the Earth’s infrared spectrum between 1970 and 2006,” Chen et al, (2007)
Sorry, I didn’t meant to imply that I thought CO2 doesn’t trap OLR. It most certainly does. My point I was trying to make in the comment was that the OLR trapping has not increased over, say 30 years. The Harries and Chen papers only show that increased trapping after filtering their data through models. Raw data don’t show that.
Except there is no such raw data, because
(1) Satellites fail
(2) water vapor amounts change
(3) ozone amounts change
You have to account for all these changes to compare CO2 from one time period to another.
Got a better method than using a model (which, after all, is just a numerical solution to the underlying PDEs)?
If CO2 did in fact trap outgoing longwave radiation then the satellites should be able to detect it.
In fact it’s easily detectable by satellite, showing up as big gouges in the blackbody spectrum:
http://www.giss.nasa.gov/research/briefs/schmidt_05/
Changes there have been detected too:
“Increases in greenhouse forcing inferred from the outgoing longwave radiation spectra of the Earth in 1970 and 1997,” J.E. Harries et al, Nature 410, 355-357 (15 March 2001).
http://www.nature.com/nature/journal/v410/n6826/abs/410355a0.html
“Comparison of spectrally resolved outgoing longwave data between 1970 and present,” J.A. Griggs et al, Proc SPIE 164, 5543 (2004). http://spiedigitallibrary.org/proceedings/resource/2/psisdg/5543/1/164_1
“Spectral signatures of climate change in the Earth’s infrared spectrum between 1970 and 2006,” Chen et al, (2007) http://www.eumetsat.int/Home/Main/Publications/Conference_and_Workshop_Proceedings/groups/cps/documents/document/pdf_conf_p50_s9_01_harries_v.pdf
Thanks for your reply. I’ve always thought the issues are so complex that anyone claiming to have definitive answers is suffering from an extreme case of hubris.
Sun cycles, El Nino, la nina, South Pacific plankton photosynthesis, surface ocean salinity, cloud cover, counter balancing effects of weather patterns, CO2 gas released from the oceans and thawing tundra as well as dozens of other natural occurring phenomena interacting on a global scale….
My head explodes just thinking about how any model could be created that wouldn’t automatically be garbage in garbage out.
You are cherry-picking your starting point to get the result you want. That’s not scientifically meaningfull….
From David comment above:
“Except there is no such raw data, because
(1) Satellites fail
(2) water vapor amounts change
(3) ozone amounts change”
From this link – http://ams.confex.com/ams/pdfpapers/24874.pdf
See Figure 1.
From this link – http://www.nature.com/nature/journal/v410/n6826/abs/410355a0.html
See Figure 1.
From this link – http://www.eumetsat.int/Home/Main/Publications/Conference_and_Workshop_Proceedings/groups/cps/documents/document/pdf_conf_p50_s9_01_harries_v.pdf
See Figure 3.
All those figures contain raw data before ‘simulated’ via models.
That data shows a mixture of effects — due to changes in CO2, CH4, H2O and O3. To separate out the effects of the noncondensing GHGs, you need to account for the changes water vapor and ozone. How would you do that without a climate model?
1) Check out Ramanathan paper at http://www-ramanathan.ucsd.edu/files/pr72.pdf third page “an increase in greenhouse gas such as CO2 will lead to a further reduction in OLR.” And “Since the emission increases with temperature, the absorbed energy is much larger than the emitted energy, leading to a net trapping of longwave photons in the atmosphere.”
Sounds like Ramanathan didn’t think we need to compensate for temperature effects to measure OLR changes.
Maybe you know more about climate science than Ramanathan?
2) Check out http://ams.confex.com/ams/pdfpapers/24874.pdf and see Figure 3. Notice no OLR reduction and this graph does compensate for Water vapor and temperature.
Also check this nifty statement in the conclusion:
“Although these strongly affect the OLR the atmospheric temperature and humidity cannot be unequivocally determined owing to the snapshot nature of the observations.”
Sounds like the author doesn’t have much faith in the models either.
Have you been able to get your stuff published in any real science magazines? Or is “American Thinker” the only place that will accept you?
I’m not sure what that has to do with our discussion but yes I have. In grad school I published in the Midwest Symposium on Circuits and Systems (elec eng paper). How about you? What journals have published your work?
Wow — that’s certainly a major journal! In Topeka, maybe, but — sorry to break this to you — no where else.
Has your work ever been published in a real scientific journal?
Has your writing ever been published in a real science magazine?
It appears not.
Until you answer my questions I’ll ignore you from here on. I will leave your comments up to show others what a clown you are.
I’m sorry. I shouldn’t make fun of you. If you got something published somewhere, good for you. But a paper on circuits and the ability to do algebra certainly doesn’t make you an expert on climate science.
Your link to Ramanathan is to a LECTURE, not a peer-reviewed result.
It’s just a transcript.
Is that really all you got?
No, there was a second part to my comment that you conveniently forgot about.
Also (of course), that data isn’t “raw.” Satellites don’t measure “brightness temperature,” they measure radiation at different wavelengths. And even that is only a sensor whose signal is composed on electric charges. Turning that information into a temperature requires…a model. (A couple of them.) ALL data requires a model — even if you read the temperature in your backyard off a mercury bulb thermometer.
Pingback: No Warming For 15 Years | cosmoscon
In the Arctic, the Gulf Stream brings warm water to the North. At the beginning of the 20th century, this was not known. But, it marked the start of an abrupt century long warming period due to the rearrangement of the North Atlantic currents. Since this change coincided with the Gulf Stream’s change to its present northerly course, and it was so sudden, it’s hard to believe it is due to rising GHGs. It is really difficult to explain this using the CO2 warming models.
In the Antarctic, we know that the West Antarctic Ice Sheet (WAIS) is melting away by the warm water rising from below in the Amundsen Sea. Since the prevailing winds are from the land to sea, this blows away the cold surface water which is then replaced by the warmer Antarctic bottom water. WAIS collapsed about 1500 years ago and may do so again.
.
Pingback: AGW Cult Doubles Down On Stupid | cosmoscon
Pingback: David Sirota, Climate Science Suuuuper Genius | cosmoscon
Pingback: Obama Pivots To Climate Change | cosmoscon
Reblogged this on CACA.
Pingback: Global Temperature and CO2 Update – March 2013 | CACA